For those more technically inclined, our guest blogger, Mark Brown from U.S. Department of Commerce, National Travel and Tourism Office, talks about one of the consistent data analysis mistakes he has seen over and over in his 30 years as a travel researcher.
We met Mark at the Travel and Tourism Research Association International Conference in Vail earlier this month.
One of the joys of being in the travel research industry for nearly three decades is seeing really good travel marketing decisions and advertising campaigns based on sound research and logic.
But conversely, the agonizing side of lasting this long has a downside, and that’s observing common logic and mathematical mistakes that can be easily avoided. One of the most common and dangerous data analysis mistakes I’ve encountered in market research is the focus on mean averages in trend data without a look—even a glance—at the components of change.
Example:
The example below shows how a weighted average national “total” can be moving in one direction, but the  components are (all in this case) moving in the opposite direction.
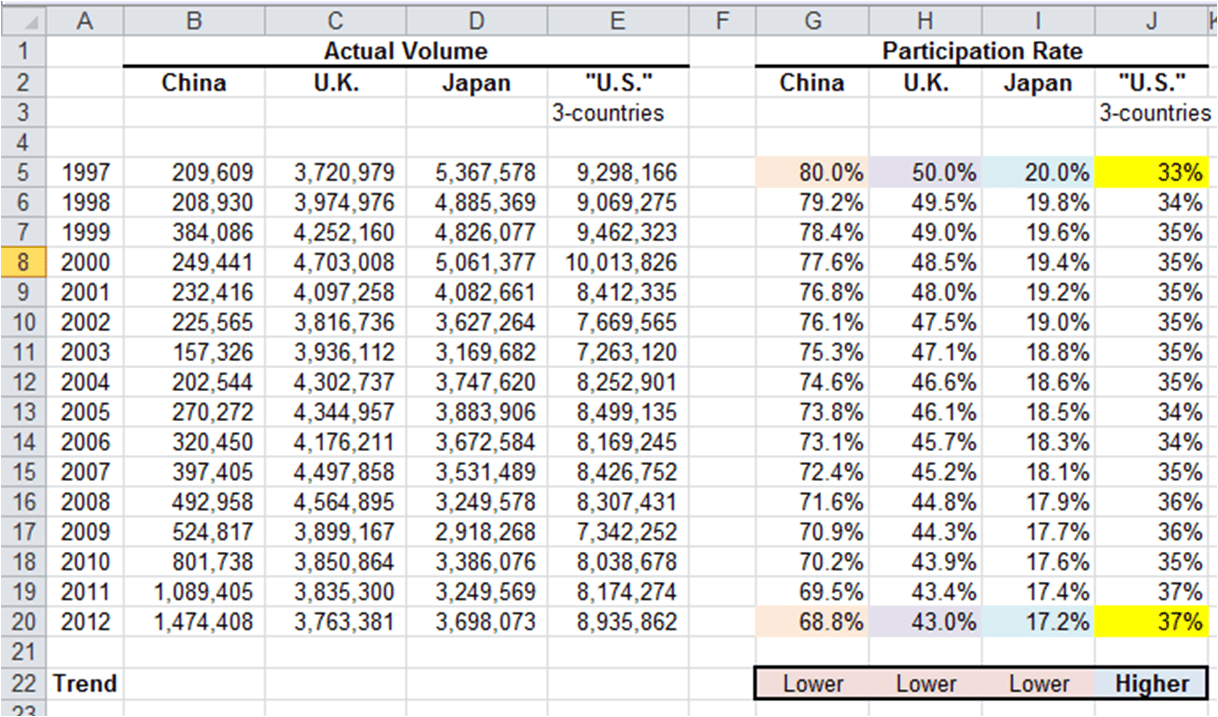
Table 1 below shows the data used for this discussion. For each year in column A, actual annual volumes from three countries to the USA are provided in columns B, C, and D.
These countries were chosen because they represent visitor origin markets for which annual volumes are trending higher (China), trending flat (U.K.), and trending lower (Japan). Column E shows the sum across these three countries and thus represents the “U.S.”
For each country, columns G, H, and I show the respective contrived incidence of participation in the (yes, fictitious) activity of “searching for unicorns.”
Column J shows the incidence for this activity at the weighted-average national level, with actual volumes used as the weight. Looking down column J, you can see that the incidence of this activity is clearly increasing.
So, with much fanfare, that is what we tell the world, “…travelers are increasingly looking for unicorns during their trip to the USA…” And perhaps we make a further comment such as, “…and this is not surprising because…”
Table 1: Trends in the Activity Participation Rate—SEARCHING FOR UNICORNS
So what’s the problem?
The problem, in this case, is…they aren’t; the incidence of this activity is actually DECREASING for every country in this three-country world.
Again, the reported statement is that this activity is increasingly popular and why it is so, but everyone with boots-on-the-ground knowledge is scratching their head and asking, “Huh?” This situation where all the components are moving in one direction and the weighted average is moving in the opposite direction may not happen often, especially when there are many components (in this case many visitor origin countries).
What does happen regularly is that the total average is moving in one direction and many of the components are moving in the opposite direction. The reported statement is said in a way to suggest the trend is universal when it isn’t. The industry is told one thing and may react to that information, but reality may be quite different.
 In fact, the marketers might be worse off knowing the research misreported “facts.” Of course, I could have played with the activity participation rates to make the difference between total trend and components’ trend wider or less wide, or apply to only one or two of the three countries, but you get the idea.
And hopefully, you can sense how this same situation can apply to any travel statistic—travel party size, stay length, trip purpose, or even with other types of data in other industries…and how it can apply to your data.
So what’s the solution?
The solution is very simple and straightforward…when reporting changes in mean average trending, we must include a discussion of the components of change…the reason or reasons for the overall total or national change. In this scenario, the weighted average of three countries’ participation rates comprise the national average, and visitor volume is used as the weight.
The activity participation rate is what gets the attention, but the change in the national average participation rate is more impacted by the change in the weight in this case—actual visitor volumes. But you say, “Mark, I need the trending insights, but I can’t afford enough sample size to slice and dice the data into various components.”
O.K., I get that, but perhaps you can at least look at the components based on a small sample and get at least a qualitative or sense of what is going on. Or perhaps you don’t really need the annual trending, but might be better served by conducting your research every two or three years, thereby doubling or tripling the sample size and permitting a more robust analysis of the components.
Your motto should be, if I don’t know why something has changed, I don’t know anything.
Mark joined NTTO in 2005 with a background in economic development, marketing research, and travel and tourism promotion and research.Mark’s public sector experience includes 11 years with NTTO, and eight years as the Research Director for the Virginia state tourism office.His private sector experience includes research positions with several leading travel research companies.
Mark is a former board member of the Travel & Tourism Research Association and is co-founder of the popular TTRA State and Provincial Travel Research (list serve) group, which provides a real-time outlet for travel researchers to share issues and solutions.His educational background is in economics, both at the undergraduate and graduate levels.


Truly awesome article Mark. I think you should be a featured columnist in more newsletters (seriously). I would like to point out one additional nuance to your recommendations. Analyzing change is very difficult in general. If your unicorn hunting data above was real, marketers and researchers could talk in circles about it for hours with a likely end result that marketers wouldn’t be very concerned because all they care about at the end of the day is overall volume, not incidence. So, in addition to unmasking some of the hidden forces at work in our data, the discussion in our reports should always include WHY marketers should care that about our findings. You already implied this but I just wanted to make it explicit. Using the Unicorn Hunting data above as an example, marketers might find a lot of value if researchers pointed out some hypothetical ‘future inflection points’ where a moderate change in Chinese arrivals could spell disaster for suppliers of unicorn sensing equipment. Also recommendations for future research would appeal to markets if we made it clear that the data currently can’t tell us whether Unicorn Hunting is fading away or whether all the Unicorn Hunters are going to one of the other three countries in increasing numbers. Then marketers would realize that they might have a competitive problem too.
Dudley, you have provided excellent additions to the topic, and I have a real example that I believe addresses your points. From 1997 to 2015 visitor volume to the USA from Japan decreased 30%, while the incidence of Japanese visitors who golfed declined 70%. Taken together, Japanese golf visitor VOLUME declined about 79%. So if I tell a golf course owner in Hawaii or California that Japanese visitor volume is down 30%, they’ll laugh at me until they cry that THEIR Japanese golf volume is down nearly 100%. And more to your second point, somewhere along the way there were likely your inflection points and other insightful details that may have suggested if, how, and when this market segment was ever coming back—either from a return to higher total Japanese visitor volume and/or a return to higher golf activity incidence. Together, our points explain why I often laugh when someone says “…we’re just using the simple average.” There’s rarely anything simple about it.